 ™
™
QUICK ANSWER
The short version
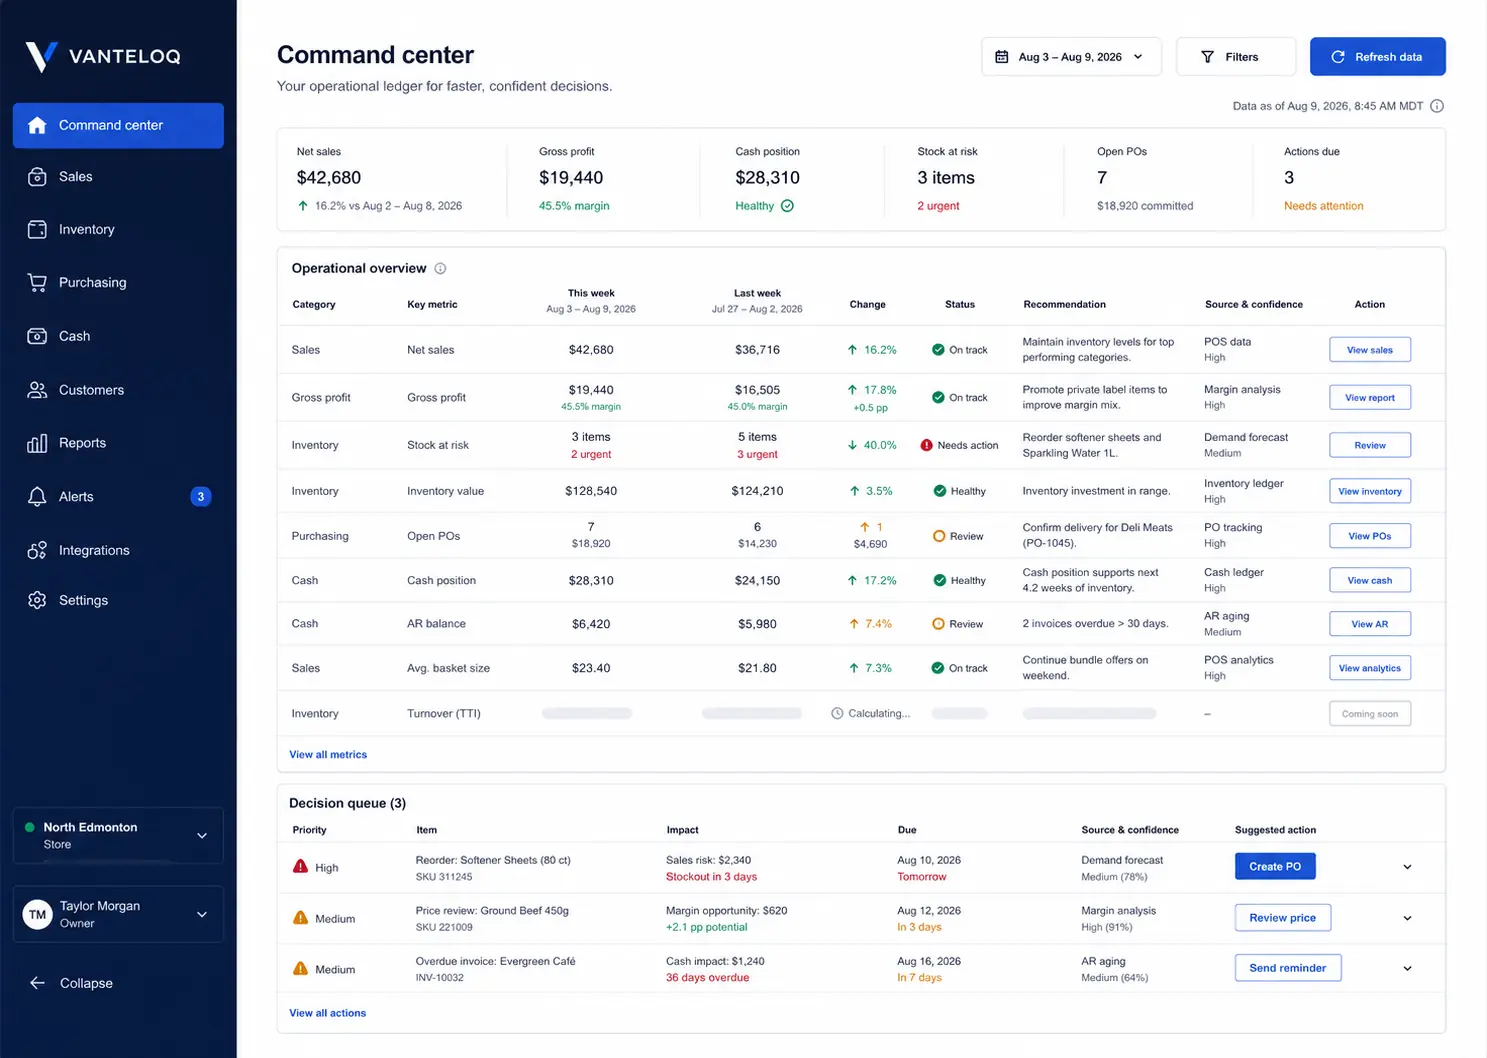
Start with a small executive snapshot: net sales, transactions, average basket, gross profit and gross margin when cost coverage is reliable, current cash with known obligations, inventory value and risk, and open operational exceptions. Every metric should show its period, comparison, source and freshness. Add product, location or channel detail only when it helps explain a change or supports an action.
Start with the decisions the dashboard needs to support
The best dashboard design begins with a management routine, not a list of available charts. A daily operating view might answer whether sales imported correctly, whether a stockout needs attention and whether a deadline has an owner. A weekly view might compare sales mix, gross margin, purchasing and staffing. A monthly view can go deeper into financial results, inventory turnover and location performance.
Write down the decisions first. Then include the smallest set of measures that makes those decisions faster or more reliable. If a number never changes a question, investigation or action, it probably does not deserve the most valuable space on the page.
Build a focused executive snapshot
Most small businesses can begin with six to ten measures. The exact set depends on the business model, reporting cadence and available records. A retailer needs inventory and product-mix context that a professional-services firm may not. A multi-location operator needs location comparison that a single-store owner does not.
Use a snapshot to show the current value and a meaningful comparison, such as the previous equivalent period, a target or a plan. Comparisons should use the same definition, currency, locations and time boundaries.
| Area | Useful starting measure | Context the measure needs |
|---|---|---|
| Sales | Net sales and transactions | Date range, locations, refunds, tax treatment and comparison period |
| Customer activity | Average basket or revenue per transaction | Transaction definition and exclusions |
| Margin | Gross profit and gross margin | Recorded cost coverage and the same period as sales |
| Cash | Current operating cash | Source time, known obligations and restricted amounts |
| Inventory | Value, stockouts and at-risk items | Cost basis, location and last verified quantity |
| Operations | Open exceptions and overdue work | Owner, priority, due date and approval status |
Give every metric enough context to be trusted
A card that says sales are $42,000 is incomplete. The reader still needs to know whether the amount is gross or net, which dates and locations it covers, whether returns are included and when the source last refreshed. The same problem applies to inventory, cash and margin.
Define each metric once and reuse that definition across views. Show unavailable when a required input is missing. If an estimate is useful, label it as an estimate and preserve the method and assumptions. This prevents a provisional number from quietly becoming an accepted fact after it is copied into a meeting or spreadsheet.
- Metric name and plain-language definition
- Current value and comparison value
- Date range, location and currency
- Source system and last successful refresh
- Actual, estimated, forecast or unavailable status
- Known limitations, such as incomplete product costs
Show sales and margin together
Revenue growth is easier to interpret when the dashboard also shows transactions, average basket, discounts, returns, product mix and supported margin. Sales can rise while gross profit falls if discounts deepen, supplier costs increase or the mix shifts toward lower-margin products.
Do not treat missing cost as zero. If recorded cost coverage is incomplete, show gross margin as unavailable or provisional and identify which products or records are missing cost. Product and location detail should be used to explain a top-level change, not to overwhelm the first screen.
Net sales of $24,000 across 600 completed transactions produces an average basket of $40, assuming the same transaction and refund rules are used throughout.
Connect inventory, cash and operational follow-through
Inventory ties up cash and creates service risk when the wrong items are unavailable. A retail dashboard should separate basic quantity visibility from decisions about purchasing. Useful inventory sections may include stockouts, negative balances, products below a reviewed reorder point, slow-moving items, expiry risk, incoming purchase orders and inventory value by location.
Cash should not be reduced to the bank balance. Known supplier bills, payroll, tax obligations and approved purchase commitments can materially change the amount available to commit. Keep confirmed obligations separate from expected or possible amounts, and show the source and as-of time.
Finally, connect important findings to work. An exception becomes useful when it has a priority, owner, due date, source reference and approval state. A dashboard that raises the same warning every day without recording the response is not closing the operating loop.
Reserve alerts for conditions that deserve attention
Colour alone does not explain urgency. Define what makes an item informational, medium, high or critical, and include text that states the condition. A useful alert explains what changed, how much it changed, which source supports it and what review is appropriate.
Avoid fixed thresholds that ignore business context. A five-percent sales decline may be expected after a promotion ends, while a smaller margin change on a high-volume category may deserve immediate review. Thresholds should be documented, reviewable and paired with human judgment.
- State the change and affected period.
- Show the supporting measure and source freshness.
- Identify missing information or calculation limits.
- Assign the review to a role or named owner.
- Record the decision and outcome so the alert can close.
Avoid common dashboard mistakes
- Adding every available metric to the first screen.
- Mixing gross sales, net sales and cash receipts without clear labels.
- Comparing periods with different store counts or operating days.
- Showing margin when product cost coverage is incomplete.
- Using charts where a value, change and short explanation would be clearer.
- Hiding data freshness, source failures or estimated values.
- Creating alerts that have no owner, approval path or resolution state.
- Designing only for a wide desktop screen and losing priority on mobile.
How Vanteloq approaches the operating dashboard
Vanteloq's current command centre can organize supported sales measures, gross-profit context, cash and obligation inputs, inventory status, data quality and operational decisions. The metric registry keeps actual, estimate, forecast and unavailable states distinct, and protected actions remain subject to workspace permissions.
The depth of the dashboard depends on connected or imported records. Lightspeed R-Series has a built read-only sales and inventory import, Lightspeed X-Series remains a read-only pilot and Stripe financial data remains staged for reconciliation. Vanteloq does not present unsupported connectors or missing source coverage as live business intelligence.
Sources and further reading
These sources support the accounting, platform or technical boundaries discussed in this guide. They are not endorsements of Vanteloq.
- Managing Books and RecordsCanada Revenue Agency
- Key Performance Indicator (KPI) visualsMicrosoft Learn
- Financial Performance DataInnovation, Science and Economic Development Canada