 ™
™
QUICK ANSWER
The short version
Data analytics for small business begins with a decision that matters, such as what to reorder, where margin changed or whether cash can support a purchase. Identify the source records needed to answer that question, reconcile them, define each metric and compare equivalent periods. Use descriptive analysis to show what happened, diagnostic analysis to investigate why, and carefully tested forecasts to estimate what may happen next. Keep source, freshness, scope and uncertainty visible. Protect personal information, separate platform attribution from verified business outcomes, and assign every material finding to an owner with a review date. A simple weekly routine built on trusted data is more useful than a complex dashboard nobody can explain.
1. Understand what data analytics means for a small business
Data analytics is the disciplined process of preparing, comparing and interpreting records so a business can make a better decision. The records may come from a point of sale system, accounting software, bank feeds, inventory movements, ecommerce orders, customer records, website analytics or carefully maintained spreadsheets. Software can speed up the work, but it does not replace clear definitions, reliable source data or management judgment.
The OECD describes a data value chain in which raw records must be cleaned, standardized, consolidated and organized before analysis can create useful information. That point matters for a smaller company. Buying a sophisticated dashboard does not fix duplicate customers, missing product costs, inconsistent locations or refunds that were recorded differently across systems.
Business analytics is often discussed in four levels. Descriptive analysis states what happened. Diagnostic analysis investigates possible reasons. Predictive analysis estimates what may happen under defined assumptions. Prescriptive analysis compares possible actions and constraints. A small business does not need to use all four levels at once. Reliable descriptive analysis is usually the correct foundation.
2. Start with a business question, not a tool
Begin by writing one decision in plain language. Good questions are specific enough to produce an action: which products need a reviewed reorder, why did gross margin change last week, can the business commit to a purchase order, or did a campaign produce matched sales within the approved measurement window? Broad requests such as "show me everything" create crowded dashboards and weak conclusions.
Define the owner, period, locations, products, comparison and deadline before selecting a metric. Also define a guardrail. A promotion may aim to increase net sales while protecting a minimum gross margin. A reorder may aim to reduce stockout risk while keeping projected cash above an approved reserve. The guardrail prevents a local improvement from creating a larger problem elsewhere.
| Business question | Minimum evidence | Possible action |
|---|---|---|
| Which products need attention? | Available stock, sales velocity, incoming stock, lead time and expiry risk | Review a reorder, transfer, markdown or supplier follow up |
| Why did margin change? | Net sales, refunds, discounts, product mix and recorded product cost | Review pricing, promotion rules, cost records or supplier terms |
| Can cash support a commitment? | Verified cash, dated obligations, approved reserves and purchase commitments | Approve, reduce, defer or reject the commitment |
| Did a campaign work? | Platform results, consented analytics events and matched commerce or point of sale outcomes | Continue, revise or stop the campaign within an approved budget |
3. Build a trustworthy data foundation
Statistics Canada evaluates data quality through relevance, accuracy, timeliness, accessibility, interpretability and coherence. A small business can use the same ideas in practical form. The data should answer a real question, describe the intended event accurately, arrive soon enough to be useful, remain available to approved users, include definitions and stay comparable across time and locations.
Create a source register before combining reports. For each system, record the owner, business purpose, available fields, historical coverage, refresh schedule, time zone, currency, identifier rules and known gaps. Preserve the raw source separately from cleaned or modeled tables. That separation makes it possible to trace a result and correct a transformation without rewriting the original evidence.
Reconciliation is the control that connects systems. Completed point of sale transactions should agree with the imported sales total under the same rules. Inventory movements should explain the change in quantity. Payment processor settlements should be reconciled to fees, refunds and bank deposits rather than treated as sales. Unmatched records should remain visible until they are resolved or accepted under a documented policy.
- Use stable identifiers for products, locations, customers and source transactions.
- Standardize dates, time zones, currencies, tax treatment and status values before comparison.
- Keep refunds, voids, transfers and adjustments as distinct events instead of hiding them in net totals.
- Show the last successful refresh and the period covered by every report.
- Label missing, estimated and provisional values rather than quietly replacing them with zero.
- Restrict access according to role and preserve an audit record for material changes.
4. Define a small metric system that people can explain
A key performance indicator is useful only when the team shares its definition. A metric contract should state the formula, source, date boundary, locations, currency, exclusions, freshness requirement and responsible owner. It should also say whether the result is an actual record, a platform attributed result, an estimate, a forecast or unavailable.
Start with a small set that covers the operating model. Retailers often need sales, margin, inventory, purchasing and cash context. Service businesses may emphasize pipeline, capacity, delivery and receivables. Add a metric only when it supports a recurring decision. Remove it from the main view when nobody can explain what action it changes.
If 920 of 1,000 eligible sold units have a valid recorded cost, cost coverage is 92%. Gross margin should disclose that limitation instead of assuming the other costs are zero.
| Area | Starting measures | Required context |
|---|---|---|
| Sales | Net sales, completed transactions and average basket | Refund rules, tax treatment, dates, locations and comparison period |
| Margin | Gross profit, gross margin and recorded cost coverage | Product cost source, missing cost records and matching sales period |
| Inventory | Available units, stockouts, inventory value and movement rate | Location, cost basis, count date, incoming stock and commitments |
| Cash | Verified cash, confirmed obligations and reviewed purchasing capacity | Bank source time, restricted funds, due dates and approved reserve |
| Customers | New purchasers, repeat purchasers and supported retention measures | Customer definition, consent, identity matching and observation window |
| Operations | Open exceptions, overdue work and resolution time | Priority, owner, due date, source evidence and approval status |
5. Use a repeatable analysis workflow
First, establish a baseline using an equivalent period. Match operating days, store count, currency, metric definition and source coverage. Then calculate the absolute change before the percentage change. A large percentage from a tiny comparison value may matter less than a modest change in a high volume category.
Next, separate the change into plausible drivers. Sales can move because transactions, average basket, price, discounting, returns, product mix or operating hours changed. Margin can move because selling prices, discounts, supplier costs, returns, product mix or cost coverage changed. Inventory can move because demand, receipts, transfers, write offs or count adjustments changed.
Segment only after the top level result is reliable. Product, category, location, channel, customer type and time of day can reveal where a change occurred, but every segment must use a consistent definition and a visible denominator. Timing and correlation do not prove cause. Mark explanations as supported, plausible or untested, then use a controlled change or additional evidence to distinguish them.
- State the question, scope, owner and deadline.
- Verify source coverage and reconcile material totals.
- Compare equivalent periods and calculate the absolute change.
- Break the result into the few drivers that could explain it.
- Check margin, cash, inventory, capacity and privacy guardrails.
- Assign an action, review date and measure of success.
- Record the result so the next analysis begins with evidence.
6. Apply analytics to sales, inventory and cash together
Sales, inventory and cash should not be analyzed as separate stories. A product can sell quickly and still be a poor reorder if margin is weak, supplier lead time is unreliable, expiry risk is high or the purchase would reduce cash below an approved reserve. A slow moving item may need a transfer or markdown rather than another order. The decision improves when each constraint is visible beside the demand signal.
For inventory, begin with verified available quantity, recent sales rate, incoming stock, supplier lead time, minimum order quantity, case pack, shelf life and current purchase commitments. Use several demand windows when seasonality or promotions matter. Treat reorder output as a reviewed proposal, not an automatic purchase, until the inputs and cash effect are confirmed.
For cash, distinguish the bank balance from safe operating capacity. Include dated supplier bills, payroll, tax obligations, debt payments, approved reserves and open purchase commitments. Expected receipts belong in a forecast, not in current available cash. A 13 week direct cash forecast can help expose timing pressure, but it should be updated when material receipts or payments change.
7. Analyze customers and marketing with privacy boundaries
Customer and marketing analysis can support acquisition, retention and service decisions, but it may involve personal information. The Office of the Privacy Commissioner of Canada explains that organizations should identify purposes, obtain appropriate consent, limit collection, limit use and retention, keep information accurate, apply safeguards and provide appropriate access. The exact legal obligations depend on the organization, jurisdiction and activity, so obtain qualified advice for the business's circumstances.
Collect the least detailed information that can answer the approved question. Aggregated product, location or cohort analysis is often sufficient. Restrict raw identifiers to approved roles, document matching rules and delete or deidentify information when it is no longer required under the approved retention policy.
Website and advertising reports also have technical limits. Google explains that Analytics reports may use sampling, approximate unique counts, privacy thresholding, grouped values and processing delays. Keep provider reported conversions separate from matched orders or point of sale records. Never add conversion totals from several platforms and present the result as verified revenue.
- Record the approved purpose before collecting or joining personal information.
- Use consent and preference records that match the intended activity.
- Limit access to the people and systems that require the information.
- Separate anonymous or aggregated analysis from identifiable customer records.
- Document attribution windows, identity rules and unmatched outcomes.
- Provide a clear path for access, correction and deletion requests where applicable.
8. Introduce forecasting and AI only after the basics work
A forecast is an estimate based on recorded patterns and assumptions. It is not a promise. Start with a simple benchmark, such as recent average demand or the same period last year, before adding a complex model. A more advanced model is useful only when it performs better on data it did not use for training and when the improvement matters for the business decision.
For time series, evaluation must preserve time order. Rolling origin cross validation trains on earlier observations and tests on later observations, so future data do not leak into the model. Compare forecast error at the same horizon the business needs, preserve prediction ranges and monitor whether accuracy changes after promotions, new products, supplier disruptions or shifts in customer behaviour.
AI can help summarize records, classify documents, identify unusual patterns or draft a list of questions. It should not invent missing values, silently change metric definitions or approve financial and purchasing decisions outside authorized controls. Keep the source evidence, calculation, model version, assumptions, confidence, reviewer and final decision together.
9. Put data analytics for small business into a weekly routine
Implementation should be narrow enough to finish. Choose one recurring decision with material value and available evidence. Do not begin by connecting every system. A completed sales and margin review for one location is a stronger foundation than six incomplete dashboards with no reconciliation or owner.
Use the first month to establish the operating rhythm. Review the results with the people who make and carry out the decision. Ask whether the metric definition was clear, the data arrived in time, the source could be traced, the action was practical and the outcome was recorded. Improve the process before expanding its scope.
- Daily: verify failed imports, critical stock exceptions and urgent cash changes.
- Weekly: review sales, margin, inventory, cash constraints and assigned actions.
- Monthly: reconcile key sources, review metric definitions and close unresolved data issues.
- Quarterly: remove unused metrics, test forecasts and confirm access, retention and privacy controls.
| Period | Work | Deliverable |
|---|---|---|
| Week 1 | Choose one decision and document its source records, owner, scope and guardrails | Decision brief and source register |
| Week 2 | Reconcile the records and approve the metric definitions | Verified baseline and metric contract |
| Week 3 | Build a compact view with comparisons, data status and exceptions | Decision ready report or dashboard |
| Week 4 | Review the evidence, assign one action and record the result | Repeatable meeting routine and decision log |
10. Avoid the mistakes that make analytics unreliable
The most common failure is treating a polished interface as proof. A dashboard can be fast, attractive and wrong. Trust comes from consistent definitions, reconciled sources, visible freshness, documented limitations and a decision record. Another common failure is collecting more data than the team can govern. Extra fields create cost and privacy risk when they do not support an approved purpose.
Do not automate an action merely because a model can produce a score. Require human approval for material purchases, pricing, customer treatment and financial decisions. Review exceptions and model errors, not only successful recommendations. Analytics improves through feedback when the predicted or expected result is compared with what actually happened.
- Buying software before defining the decision and metric.
- Comparing periods with different locations, operating days or source coverage.
- Treating missing values as zero or estimates as actual records.
- Assuming correlation, attribution or model confidence proves causation.
- Ignoring refunds, fees, tax treatment, transfers or duplicated records.
- Showing precise forecasts without ranges, error history or assumptions.
- Collecting personal information without a documented purpose and control set.
- Raising alerts without an owner, deadline, approval path or resolution state.
How Vanteloq applies this method
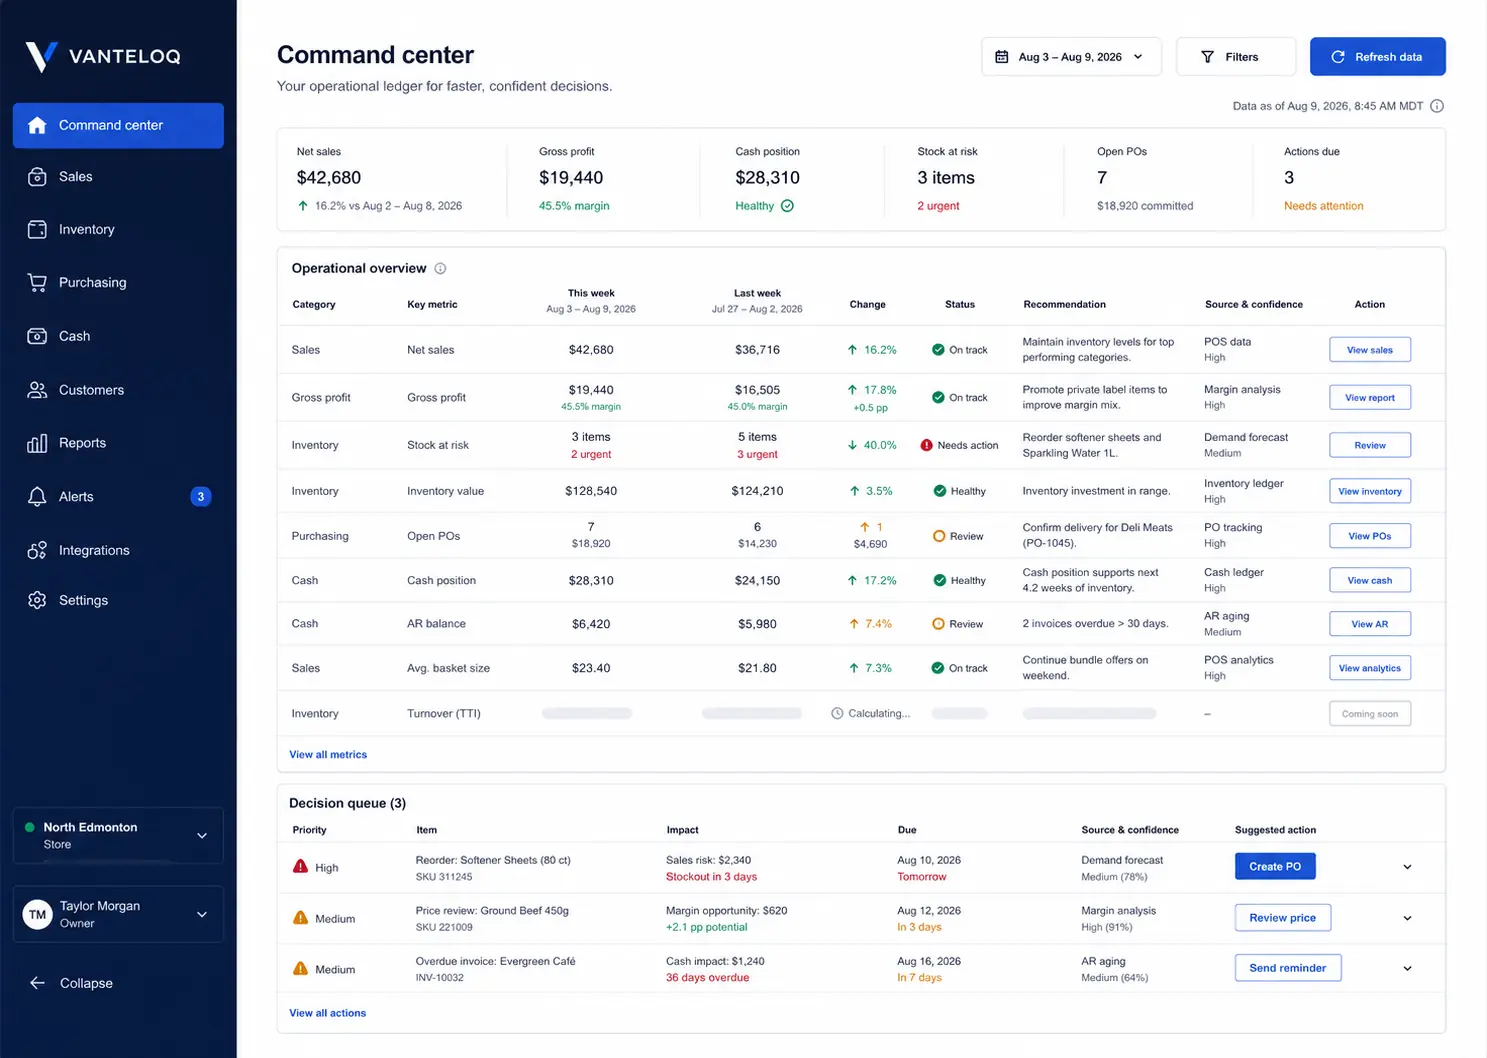
Vanteloq is designed to organize supported operating records around practical decisions. Its business views can bring sales, recorded cost, inventory, purchasing, cash context, source status and assigned work together while preserving the period, location, freshness and calculation context. The available depth depends on the records a workspace connects or imports.
The platform distinguishes actual, attributed, estimated, forecast and unavailable results so missing evidence does not quietly become a fact. Important findings can be connected to an owner, due date and review path. That structure supports a repeatable analytics routine while keeping professional accounting, tax, legal and management judgment with the responsible people.
Sources and further reading
These sources support the accounting, platform or technical boundaries discussed in this guide. They are not endorsements of Vanteloq.
- Data Analytics in SMEs: Trends and PoliciesOrganisation for Economic Co-operation and Development
- Statistics Canada Quality GuidelinesStatistics Canada
- Reporting data expectationsGoogle Analytics
- PIPEDA fair information principlesOffice of the Privacy Commissioner of Canada
- Time series cross-validationForecasting: Principles and Practice
- Business Intelligence and Analytics: From Big Data to Big ImpactMIS Quarterly