 ™
™
QUICK ANSWER
The short version
Begin with one decision, not a collection of charts. Compare a clearly defined metric with an equivalent period, then split the change into its likely drivers. Check whether margin, cash, inventory, staffing and location capacity can support the next action. Run a bounded test with a primary measure, a guardrail and a review date. Keep provider-attributed marketing results separate from verified sales and record what the evidence can and cannot prove.
1. Start with a decision the business can make
Analysis is useful when it changes a decision, a priority or a follow-up. A broad request such as "show me growth" invites a broad dashboard and a vague conclusion. A stronger question is specific: should this location extend weekend hours, should this product receive more stock, or should this campaign receive another two weeks of budget?
Write the decision, owner, scope and deadline before choosing metrics. Then identify the minimum evidence needed to answer it. A product promotion, for example, needs demand evidence, available stock, replenishment timing, supported unit economics and a cash limit. If one of those inputs is material and missing, the responsible result is blocked or provisional, not a confident recommendation.
2. Give every number a metric contract
Two reports can use the same label and still measure different things. Net sales may include or exclude returns, taxes, tips, shipping or cancelled orders. A customer count may mean profiles, purchasers or transactions. Record the definition before comparing the values.
A useful metric contract states the numerator, denominator, currency, date boundaries, time zone, locations, source system, refresh time and exclusions. It also states whether the value is an actual business record, a provider-attributed result, an external estimate, a forecast or unavailable. This context prevents a clean-looking chart from hiding incompatible records.
| Field | Question it answers | Why it matters |
|---|---|---|
| Definition | What exactly was counted? | Prevents similar labels from being treated as identical |
| Scope | Which dates, locations, products and channels are included? | Keeps comparisons equivalent |
| Source | Which authorized record produced the value? | Makes the result traceable |
| Freshness | When did the source last update successfully? | Separates a current signal from a stale one |
| Status | Is it actual, attributed, estimated, forecast or unavailable? | Keeps uncertainty visible |
3. Separate what changed from why it changed
First calculate the absolute and percentage change using comparable periods. Then decompose the result. Sales can move because the number of transactions changed, the average basket changed, the mix shifted, prices moved, refunds changed or a location operated for a different number of days. Margin can move because of discounting, product mix, supplier costs, returns or missing cost records.
Percentage change is unavailable when the comparison value is zero. Report the absolute movement and label the result as new activity instead of dividing by zero or inventing a percentage.
Treat each explanation as supported, plausible or untested. Timing alone does not prove cause. A campaign and a sales increase can occur together while seasonality, a new location, a price change or an unrelated event explains some of the movement. The next analysis should be designed to distinguish those possibilities.
If equivalent weekly net sales move from $40,000 to $44,000, the increase is $4,000 or 10%. The formula describes the change, not its cause.
4. Check whether the operation can support growth
Growth is not only a demand problem. A plan can increase revenue and still create a cash shortage, a stockout, weak contribution or a service failure. Before committing money, connect the proposed action to the constraints that could make it unsafe.
Use a range when an input is uncertain. Supplier lead time, future demand and campaign response are not fixed facts. A conservative scenario, a working scenario and an upside scenario are more useful than one precise forecast that hides uncertainty.
| Area | Evidence to check | Stop or revise when |
|---|---|---|
| Margin | Net selling price, discounts, refunds, recorded cost and included variable costs | Cost coverage is incomplete or the action breaks the approved contribution floor |
| Cash | Available balance, protected cash floor and known near-term obligations | The commitment would reduce cash below the approved floor |
| Inventory | Available units, incoming stock, demand history, safety stock and supplier lead time | Fulfilment risk is not supported by enough stock or replenishment time |
| Capacity | Staffing, operating hours, storage and service constraints | The location cannot deliver the expected volume reliably |
5. Compare useful segments without losing scope
A blended result can hide the part of the business that moved. Break a supported change into product, category, location, channel, customer type or time-of-day segments only when those dimensions are recorded consistently. Start with the largest absolute contributors rather than chasing the largest percentages from tiny samples.
Location comparisons need special care. Align operating days, currency, tax treatment and store mappings. A new store should not be compared with a mature store as though both had the same history. Regional demand should not be inferred from one location unless broader evidence supports it.
- Compare the same metric definition across every segment.
- Show the denominator so a small sample is visible.
- Separate a location-specific pattern from a business-wide pattern.
- Mark unmapped or shared transactions instead of assigning them to a convenient location.
6. Use marketing and SEO data without double counting
Marketing platforms report valuable evidence, but each platform can assign credit under its own attribution model and time window. Keep Google Analytics, advertising-platform, commerce, CRM and POS outcomes separate at ingestion. Compare them in one decision packet, but do not add their conversion totals together or call provider-attributed revenue verified profit.
For SEO, begin with the business's own Search Console clicks, impressions, pages and queries. Search Console can omit anonymized and lower-volume query rows, so a detailed query table may not equal the headline total. Use third-party keyword or traffic estimates for discovery, label them as external estimates and validate important opportunities against site-owned evidence.
A useful SEO review asks which relevant pages receive impressions, whether clicks and click-through rate changed, which search intent the page serves, and whether the visit leads to a supported business outcome. Publishing more pages is not the goal. Clear, original content that helps the intended reader and is reviewed before publication is the safer operating standard.
7. Run a bounded test and measure the result
Turn the leading explanation into a testable action. State the hypothesis, baseline, primary measure, guardrail, budget ceiling, owner, start date, review date and rollback condition. Change one important variable when practical so the result can teach the team something.
Choose a review window that matches the decision. A daily stockout response and an SEO content change do not mature on the same schedule. Record the outcome even when the test fails. A decision journal prevents the same unsupported idea from returning every quarter and gives future analysis better context.
- State what you believe will change and why.
- Record the baseline and the exact source definition.
- Approve the spending, inventory and cash limits.
- Measure the primary result and at least one guardrail.
- Record what happened, what remains uncertain and the next decision.
How Vanteloq strengthens the analysis loop
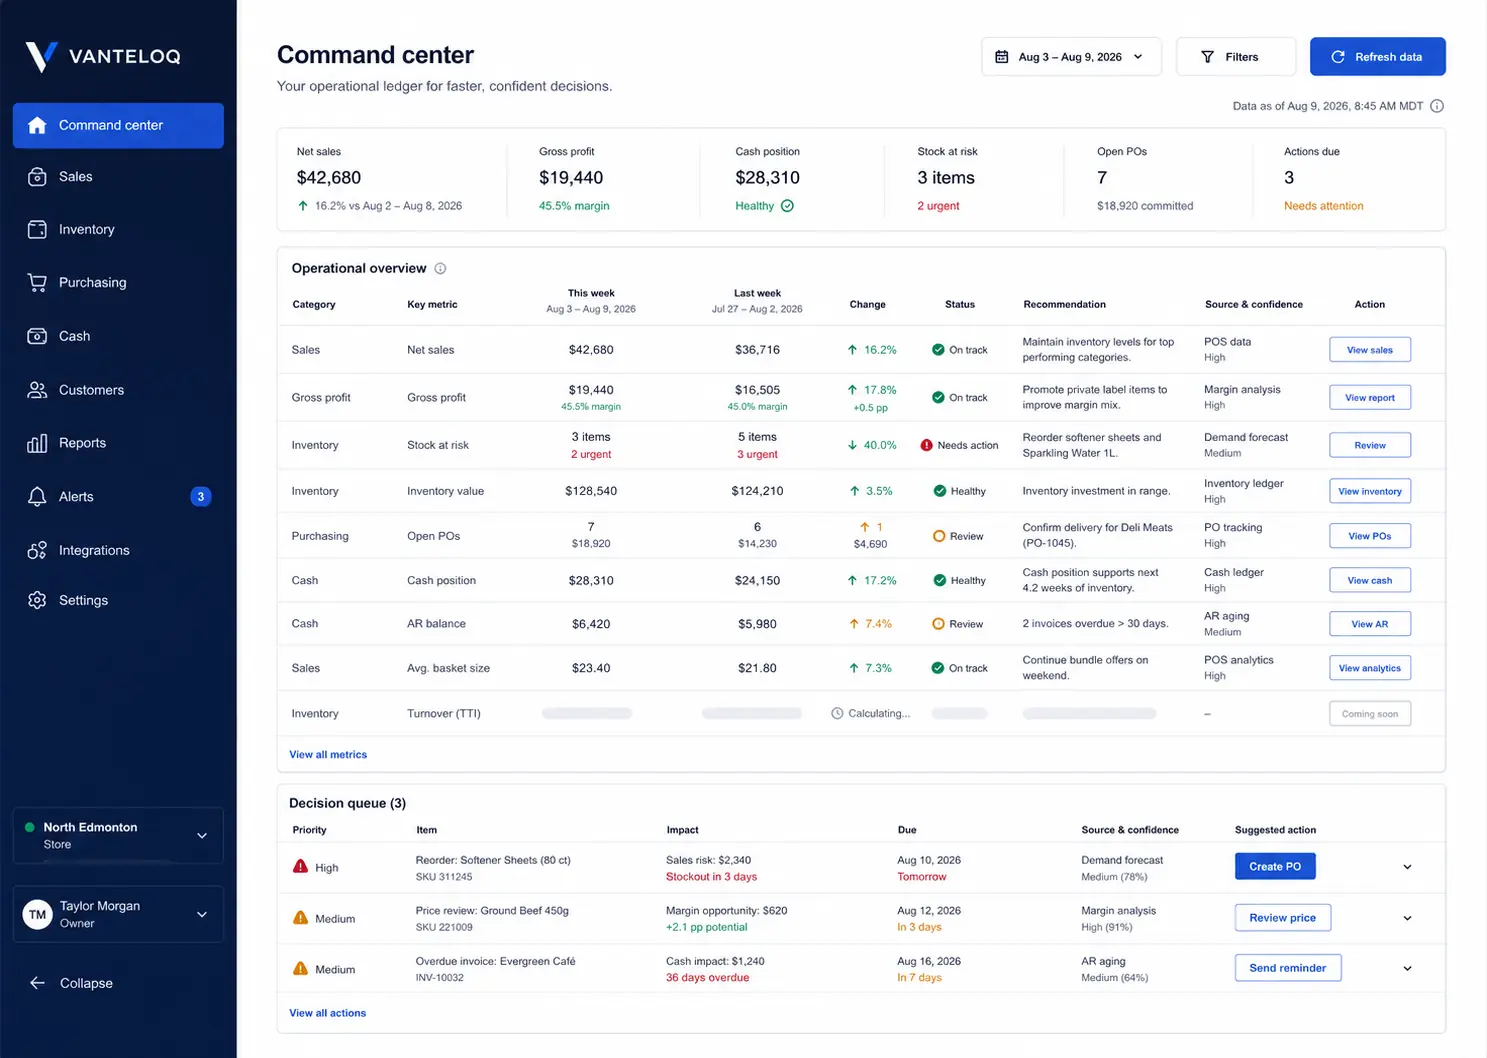
Vanteloq is designed to keep the decision beside its supporting records. A connected operating view can align sales, recorded cost, cash context, inventory, purchasing, location and assigned work while preserving source, period, status and missing-input warnings. That reduces the manual effort of rebuilding the same comparison across separate exports.
The platform should not make unsupported growth promises. A recommendation is useful when it shows what changed, the calculation, the evidence used, the operational constraints, the missing inputs, the responsible owner and the method for reviewing the result. When a source or permission is unavailable, Vanteloq should say so and keep the decision blocked or provisional.
Sources and further reading
These sources support the accounting, platform or technical boundaries discussed in this guide. They are not endorsements of Vanteloq.
- Google Analytics Data API reporting basicsGoogle for Developers
- Search Console performance report overviewGoogle Search Central
- Search Analytics query method and data boundariesGoogle for Developers
- SEO Starter GuideGoogle Search Central
- Financial Performance DataInnovation, Science and Economic Development Canada